Data & Statistics

Tracking trends in transportation allows for a better understanding of where we are succeeding in advancing our transportation sustainability goals and where we are falling short. The following transportation goals related to the environment, economy and healthy communities have been developed for the Santa Cruz County Regional Transportation Plan and are the basis for the data that is being compiled.
GOAL 1. Improve people’s access to jobs, schools, health care and other regular needs in ways that improve health, reduce pollution and retain money in the local economy.
GOAL 2. Reduce transportation related fatalities and injuries for all transportation modes.
GOAL 3. Deliver access and safety improvements cost effectively, within available revenues, equitably and responsive to the needs of all users of the transportation system, and beneficially for the natural environment.
Santa Cruz County Traffic Counts


Commute Patterns
Mode Share


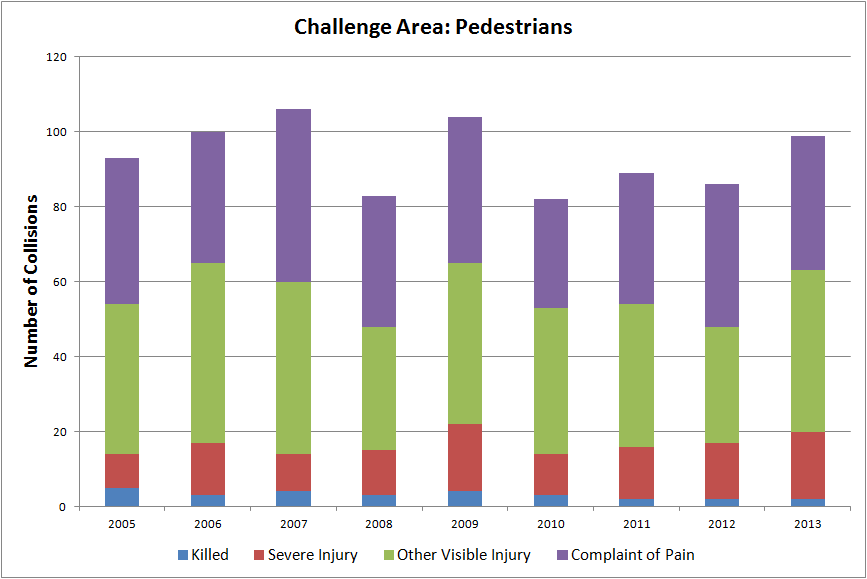
Safety


Monthly Transit Ridership Data
The RTC is required to make publicly available a summary of monthly ridership data, consistent with the data submitted to the Federal Transit Administration (FTA) National Transit Database (NTD), from all transit operators within its jurisdiction and covers the time period starting on July 1, 2022, through at least June 30, 2028.
Subscribe to our Mailing List
Latest news and up-to-date info delivered to your inbox
Report a Hazard
Notify us of obstacles or hazards that may inhibit travel.